

Introduction
Concerns about overfishing and fishery collapse, low incomes of fishers, and compliance with fishery rules are leading governments around the globe to consider fishery management reform proposals like Territorial Use Rights for Fisheries (TURF) programs (Afflerbach et al., 2014; “Sustainable fisheries,” 2013; “Territorial Use Rights for Fishing (TURF) Programs,” 2013). A TURF program divides a fishery into discrete spatial areas called “TURFs.” Fishers, groups of fishers, or the community are put in charge of the individual areas and manage them either independently or with some level of oversight by the fishery’s managing authority. The literatures on Common Pool Resources and fishery economics contain many papers arguing TURFs can save fisheries from collapse and empower local communities, which has led to a recent flurry in establishing TURFs (Brown and Pomeroy, 1999; Janssen and Ostrom, 2008).
Though TURF reforms frequently involve dividing a fishery into smaller sub-fisheries, little work considers how these TURFs and their fishers impact others. Previous research examines how individual TURFs behave, and compares outcomes in single government-managed fisheries to outcomes in single self-managing TURF fisheries. But if TURF systems involve dividing whole fisheries into smaller parts they necessarily create multiple TURFs. Whether TURFs harm or help neighboring TURFs is therefore critical. A large body of experimental research examining competition between groups in other contexts reports a “minimal group paradigm” and “groupiness.” The paradigm suggests groups form out-group biases and express destructive behavior toward other groups, even when group assignment is seemingly random or based on trivial things (Chen and Li, 2009; Diehl, 1990; Hargreaves Heap and Zizzo, 2009; Tajfel et al., 1971; Tajfel and Turner, 2001). The concept of “groupiness” refers to whether subjects show bias between members of their group and members of another group (Kranton et al., 2018). Dividing fishers into groups may initiate groupiness and minimal group paradigm behavior. Unless researchers investigate how TURF groups affect each other, well-intentioned fishery management proposals might hurt the very fisheries and communities they mean to help.
We design an economic experiment enabling us to determine the effort fishers will expend to protect their fishery, and whether delegating authority over a resource to users improves profits and sustainability. Economic experiments have been used extensively to examine a range of real-world policies (Banks et al., 2003; Falk and Heckman, 2009; Ishikida et al., 1998). In our experiment users are in a Common Pool Resource context simulating a fishery. They are either united in a single group of 6 fishers, or divided into two groups of 3. Players are either under a harvest management regime set by an outside management authority, or they collectively design the management regime they harvest under. The experiment compares the potential outcomes of a harvester-managed fishery like a TURF to a classic government-managed one; but unlike previous work ours takes into account how individual TURFs affect each other. Utilizing a treatment with two groups of fishers able to poach from each other’s management areas, we examine intra-fishery dynamics to compare large, united, government-managed fishery performance to small, divided TURF fisheries.
We find dividing a fishery into sub-fisheries leads to suboptimal outcomes, and self-managing improves outcomes. Despite comparable “rules of the game” overall, players change their behavior after we divide a fishery into smaller sub-fisheries. As a result, there are statistically significant decreases in fisher incomes and resource sustainability, as well as increases in violations of fishery regulations. Members of divided fisheries harvest 20% more fish overall and have incomes 37% lower relative to members of united fisheries. Self-managing statistically significantly increases incomes, improves resource sustainability, and increases stewardship and resource protection. The average income of self-managing fishers is 23% higher than outside-managed fishers and they harvest 12% fewer fish relative to outside-managed fishers. The results indicate decision-makers must be careful and consider group competition dynamics when designing and implementing fishery management reforms.
Territorial Use Rights for Fisheries (TURFs)
Fisheries around the world are in trouble (Mathiesen, 2012), and critics argue current fishery management is ineffective (Macinko and Raymond, 2001). In a developed country such as the United States, the rate of illegal fishing is estimated to be about about 12% by fishers and 24% by enforcement officials (King et al., 2009). The rates in the developing world can be considerably higher, up to 40% (Agnew et al., 2009). Meanwhile, fishery managers struggle to keep biological levels sustainable, maximize revenues of fishers and their communities, and enforce management programs (Gerrodette et al., 2002). TURFs are proposed to alleviate some of these issues in certain circumstances, particularly for geographically confined benthic fishery species (Uchida et al., 2010; Wilen et al., 2012).
In his seminal book on the subject, Christy explains that TURF programs give rights over a fishery to an individual or some group or organization, like a local community, a community group, a co-operative of fishermen, or a corporation (Christy, 1982). Such rights include the right of exclusion and the right of setting the harvest level. TURFs frequently are used in areas where acquiring and defending the resource can be done easily, such as lakes and lagoons. However, they are also used in other geographies around the world, such as reefs and beaches (Christy, 1982). TURFs differ from traditional common property, because TURF owners have the right to exclude others from the resource.1Under the concept of common property, everyone in the community has a right to the resource (Macpherson, 1978). Exclusion allows rents to be generated by preventing new entrants to the fishery (who would dissipate rents) and is a critical reason for the promotion of TURF programs.
TURFs have recently become popular in fishery economics to address the fisheries crisis. The popularity is due to two main reasons. First, instituting tenure over a resource, as a TURF does, supposedly represents the optimum for the resource. Theory says users with secure tenure will steward resources they have an ownership stake in. Tenure and the ability to set management policies are thought to make users more invested in and compliant with fishery rules and set management policies promoting the well-being of the resource (Epstein et al., 2018). For over 60 years fisheries economists have argued sole ownership of entire fisheries would create the most economic value, because of the importance of tenure and involvement in the management process (Scott, 1955). Second, TURFs allow development opportunities since they can be established at the community level and the community can use the resources of its TURF to improve its economy. Activities leveraging the TURF can include organizing fishers to maximize yield, investing in projects to create value-added products, and more (Cunningham, 2013; Poon and Bonzon, 2013).
TURFs are hoped to improve compliance with Total Allowable Catch levels, improve sustainability, and encourage fishers to enforce rules and patrol the fishery. One of the major arguments for TURFs is they will reduce illegal and harmful fishing. The argument is that, under TURFs, fishers will feel more responsible for their fisheries and will reduce harvests to more sustainable levels. Additionally fishers will become enforcers of fishery regulations and provide surveillance of the fishery to detect, reduce, and prevent illegal fishing (Poon and Bonzon, 2013).
TURFs have existed for centuries around the world, and many are successful (Panayotou, 1984). Chile has probably the most famous TURF program in the world (Aburto et al., 2013; Aburto and Stotz, 2013; K. Davis et al., 2015a; Defeo and Castilla, 2005). A Chilean TURF program for the loco snail fishery increased stock size and increased profits (Wilen et al., 2012). Implementing a TURF for the lobster fishery of Punta Allen, Mexico, increased stock size and stabilized catch (Poon and Bonzon, 2013). A TURF program at the individual level for the Nova Scotian sea urchin dive fishery increased the profitability of the fishery (Miller, 2008). In Nova Scotia the TURF specifically decreased costs. Furthermore, biological stability from the TURF created income stability for fishers through pre-arranged sales. Increasing economic stability for fishers allowed the surrounding town to lean on the new reliable income to improve access to financial resources (Poon and Bonzon, 2013).
Despite many success stories from TURFs, some TURFs are not successful (Chuenpagdee and Jentoft, 2007; Fernández et al., 2011). Frequently, major problems with poaching and enforcing TURF regulations persist, even though fishers now have an incentive to enforce the rules (Cunningham, 2013; Davis et al., 2015b). There are also risks that a TURF’s owners will “cash out” by selling it to an unapproved party, or by exploiting their resource to extirpation to secure an immediate windfall (Clark, 1973; Orensanz and Parma, 2010). Such outcomes can occur in the absence of any rules or enforcement by the government to prevent them.
Therefore, while TURFs are a popular proposal for dealing with issues in fisheries around the world, we need more research to make informed decisions. A major gap in the literature is the impact individual TURFs have on each other. TURFs allow for communities to manage their own resources at a small scale and can reduce competition for space within the TURF (Poon and Bonzon, 2013). However, dividing large fishery management areas into small-scale management TURFs implies there will be multiple TURFs in close proximity. This raises important questions. Do members of TURFs poach so much more from other TURFs that they have higher overall harvests than before the fishery was divided (González et al., 2006; San Martín et al., 2010)? Do smaller-scale groups manage their resources better than larger groups when there are other non-group fishers able to harvest from their TURF (McCay, 2017; Orensanz and Parma, 2010)? There is not yet sufficient research on inter-TURF behaviors to answer questions about whether the benefits of TURFs diminish when they interact with one another.
Previous Experiments
Previous research on TURFs does not include multiple TURFs interacting with each other and so has not determined their impacts on each other. The existing publications on TURFs merely examine the differences between an outside-managed fishery and a self-managing fishery. They find TURFs have difficulties managing outside poaching and establish suboptimal management programs. General Common Pool Resource and TURF-specific experiments report that communication between group members leads to different outcomes. Our experiment determines how TURFs affect each other, strengthens the findings about the management regimes TURFs select, and adds evidence to the debate regarding the impacts management and communication have on TURF outcomes (Abatayo and Lynham, 2016; Cardenas, 2000).
While many experiments evaluate behavioral changes of individuals regarding the management of CPRs, they have only recently been applied in the context of TURFs. Experiments about TURFs are a frontier in the fields of fishery economics and development economics. Relevant papers considering TURFs in an experimental context are all recent (Abatayo and Lynham, 2016; Arroyo-Mina and Guerrero, 2018; Chávez et al., 2018; Gallier et al., 2016; Santis and Chávez, 2015; Wakamatsu and Anderson, 2018). While some of the experiments are conducted in laboratories, most take place in the field. The findings of our laboratory experiment are therefore more generalizable than most previous experiments. Additionally, Chávez et al. (2018) find no significant differences between the behavior of Chilean fishers in a field experiment and university students in a laboratory experiment. Therefore, even though our results are more generalizable than a field experiment and will apply well to a wider range of contexts, they will still apply well to TURFs in the field.
Furthermore, unlike previous TURF experiments, our work analyzes TURFs in the context of the entire fishery of which they are a part. Most of the previous work analyzes whole fisheries converted into a single fishery-wide TURF. Frequently when a TURF system is established, the original fishery is divided into smaller geographic units which make up the new TURFs (Aburto et al., 2013). Previous work only analyzing an entire fishery converting to a single TURF misses the dynamics that occur between the resulting TURFs. Our experiment fills the critical gap in the literature about the impacts of TURFs on each other and helps inform fisheries policy around the world.
Chávez et al. (2018) conduct a TURF experiment using 2 groups of 3 fishers harvesting 2 different-colored locos (an abalone) in a shared fishery. The stocks of both locos are dynamic and have a threshold where if the stock ever falls below the threshold the fishery for that colored loco will close. The fishers play 5 different treatments of the game:
- No poaching (no one can fish for a different colored loco than has been assigned to them).
- Poaching occurs (one group can harvest both types of loco).
- Poaching occurs but fisher groups decide how much surveillance (the probability of someone illegally harvesting being caught) they will pay for to discourage poaching.
- Poaching occurs but the government provides surveillance with an 11.1% chance of catching people poaching.
- Poaching occurs but the government provides an 11.1% surveillance level, and the players can augment that surveillance with additional money.
The authors find TURFs have difficulty deterring poaching and establish suboptimal management regimes despite significant benefits from better regimes. Outside surveillance by the government does deter poaching. While Chávez et al. (2018) provide an excellent study of TURF responses to poaching, the interaction between TURFs remains unexplored.
Our experiment differs from Chávez et al. (2018) because they incorporate a dynamic stock aspect and do not include reciprocal inter-TURF dynamics. In their experiment one group of participants can communicate with each other and self-manage, while another group harvests from the main group’s resource. The asymmetric context is specific to a fishery where only one group can harvest from another and does not analyze how TURFs affect each other back and forth. Chávez et al.’s experiment examines one TURF where outside poaching is a problem. Our experiment has two TURFs divided together, a setup similar to some of the TURF fisheries of Chile where neighboring groups of fishers negatively affect each other (Orensanz and Parma, 2010; San Martín et al., 2010). Additionally, their set-up allows them to compare the outcomes from self-managing and full communication between all the relevant fishery users to self-managing and partial communication between all the users. Like us, partial communication results from restricting your communication to half of the potential fishers in your fishery.
De Geest et al. (2017) has a similar setup to Chávez et al. (2018), with players in one TURF and “outsiders” able to harvest from it, but uses a static harvest game with crowding effects similar to our experiment. Like us, they conduct a laboratory experiment that does not frame the game in any context (such as a fishery), thereby allowing their results to be more generalizable. They find group members are able to cooperate with each other, but they are unable to control the level of poaching by outsiders.
Previous experiments find self-managing CPR users do not select optimal management programs. An experiment by Velez et al. (2012) examines the management regimes users select to protect and manage their CPR. In their setting, strong enforcement efforts (either higher penalties for illegal harvesting or higher levels of surveillance) should theoretically always be preferred to lower levels. However, in their experiment individuals implement inefficient and weak surveillance and penalty levels. Despite voting on important aspects of the enforcement regime and communicating with other group members, 80% of individuals vote for the suboptimal enforcement regime with low penalties and low surveillance levels. 90% of groups implement such programs. Additionally, Janssen et al. (2013) report a field experiment where users break the rules they choose for themselves. We contribute to the CPR self-management literature by measuring the legal harvest limits and surveillance levels self-managing groups choose, as well as violations of the limits groups set for themselves.
The impact of communication and collective decision-making on outcomes in TURFs in experiments varies. Outside of TURF contexts, communication and democratic rule-making generally improve economic outcomes (Dal Bó et al., 2010), including in other fishery contexts (del Pilar Moreno-Sánchez and Maldonado, 2010). Abatayo and Lynham (2016) find allowing TURF users to communicate about resource management leads to significantly lower—and more sustainable—harvest levels. Gallier et al. (2016) find similar effects from democratic self-managing in some of their TURF experiment sites, but in others outside management suggestions perform better. (Schmitt et al., 2000) describes a CPR experiment where restricting communication in a group of harvesters to a subgroup of the harvesters effectively reduces cooperation. Velez et al. (2012) find communication does not reduce harvest levels to sustainable levels. These diverse findings indicate outcomes are dependent on local contexts and policies are not generalizable. While evidence outside of research on TURFs suggests communication and endogenous management improve economic outcomes, the impact for TURFs is mixed, and more research is needed.
A large body of experimental research finds a minimal group paradigm and groupiness can lead to group biases and suboptimal outcomes. Minimal group paradigm suggests suboptimal outcomes occur because groups form out-group biases and exhibit destructive behavior toward other groups, even when group assignment is seemingly random or based on trivial things (Chen and Li, 2009; Diehl, 1990; Hargreaves Heap and Zizzo, 2009; Tajfel et al., 1971; see Tajfel and Turner (2001) for an overview of early work on the subject). In addition, “groupiness” appears in experiments examining group competition (Kranton et al., 2018). Groupiness refers to a related bias, where subjects become biased toward members of their own group and against members of other groups. In our experiment, dividing players into separate groups may initiate groupiness and minimal group paradigm behavior.
Working with the experimental design of Abatayo and Lynham (2016) we are able to explicitly test behavioral group concepts like “us versus them” and groupiness, concepts not previously explored in the TURF context but important for inter-TURF dynamics. The major findings of Abatayo and Lynham are that communication improves outcomes relative to no communication and that whether rules are exogenously imposed or endogenously selected does not impact efficiency. In extending their work, we find “groupiness” effects that persist regardless of any change in ability to communicate and manage.
Model
The models of Abatayo and Lynham (2016) and Schnier (2009) guide us in determining the impacts TURFs have on each other. We have two spatially distinct Common Pool Resources, and a constant number of agents able to extract from the CPR system,  .
.  identifies the extraction of user
  in
in  .
.  is the value of extracting CPRs. Users cannot extract more than their endowment of time,
  , from both CPR 1 and CPR 2:

The group’s returns are a function of the total extractions from both CPRs, , with each individual CPR’s return being given by
  . We have no spatial linkages between the CPRs where extractions in one directly impact the other.
Each CPR’s yield function is given by the following standard quadratic functions:
(1) 
and
(2) 
The first term in the parentheses shows the benefits of extracting from the group’s CPR, the second shows the costs.
The private returns are shown by
(3) 
where  is
is  share in the total extraction from CPR. Users are profit-maximizers who cannot extract more from both CPRs than their endowment. Extracting from the CPR earns more than the outside option, , initially, but as grows extraction eventually becomes less profitable. With identical , , and
  , we can find the following symmetric Nash Equilibria:
(4) 
and
(5) 
In our experiment design both CPRs have identical parameters so  and
and  . With
  , we can simplify Equations (4) and (5) to
(6) 
and
(7) 
With members in a group, the total symmetric Nash Equilibrium extraction in each CPR is
(8) 
The socially optimal level of extraction maximizes profits for the entire group. To find the socially optimal level chosen by a Social Planner, we use the objective function:
(9) 
given aggregate extractions cannot exceed aggregate endowments ( ).
).
The socially optimal levels of extraction for the group are
(10) 
and
(11) 
With ,  , and
, and  we get
(12) 
The individual socially optimal extractions are
(13) 
Extractions in the Nash Equilibrium are unsurprisingly higher than the socially optimal extractions.
The above model describes extracting from two CPRs. For users only able to extract from a single CPR, the above extraction amounts for each CPR hold for the lone CPR. By removing CPR 2 from the model (a simple operation because there are no linkages between the CPRs) we identify the socially optimal extractions for the group and individual as
![\[X^{S P}=\frac{\alpha}{2 \beta}\]](https://www.thecgo.org/wp-content/ql-cache/quicklatex.com-43622f7ef2bb3173ebc93adbf91c8f50_l3.svg "Rendered by QuickLaTeX.com")
and
![\[x^{S P}=\left(\frac{1}{n}\right)\left(\frac{\alpha}{2 \beta}\right)\]](https://www.thecgo.org/wp-content/ql-cache/quicklatex.com-3541b0a562414be0e086fa43b332b86e_l3.svg "Rendered by QuickLaTeX.com")
The Nash Equilibrium extractions are
![\[X^*=\left(\frac{n}{n+1}\right) \frac{\alpha}{\beta}\]](https://www.thecgo.org/wp-content/ql-cache/quicklatex.com-3711ddd5ac9e8646bb45bdeaebb03dac_l3.svg "Rendered by QuickLaTeX.com")
and
![\[x^*=\left(\frac{1}{n+1}\right) \frac{\alpha}{\beta}\]](https://www.thecgo.org/wp-content/ql-cache/quicklatex.com-5bd3fb383fa6252eae71fd33ff075a77_l3.svg "Rendered by QuickLaTeX.com")
To directly compare extraction levels between CPR setups we can see
is half of
![\[X_1^*+X_2^*=\left(\frac{n}{n+1}\right) \frac{\alpha}{\beta}+\left(\frac{n}{n+1}\right) \frac{\alpha}{\beta}\]](https://www.thecgo.org/wp-content/ql-cache/quicklatex.com-de5cd496289baba84a1ea19ec8dbc306_l3.svg "Rendered by QuickLaTeX.com")
and
is half of
![\[X_1^{S P}+X_2^{S P}=\left(\frac{\alpha}{2 \beta}\right)+\left(\frac{\alpha}{2 \beta}\right).\]](https://www.thecgo.org/wp-content/ql-cache/quicklatex.com-7bcf229513d80ac1e68a09dca915385f_l3.svg "Rendered by QuickLaTeX.com")
Individuals with two CPRs to extract from behave like individuals with a single CPR to extract from, for each of their two independent CPRs. A management regime for the CPR(s) and the possibility of violating the regime is the final component of the model.
Management and Fines
With homogenous, risk-neutral profit-maximizers and a wage of 0 outside the group account we can use the following profit function:
![\[\text { Profit }_j=\alpha x_j-x_j\left(\beta X_j\right).\]](https://www.thecgo.org/wp-content/ql-cache/quicklatex.com-3a5981b62fb30e057d76a6febd5019de_l3.svg "Rendered by QuickLaTeX.com")
In reality users of many CPRs, and by definition all TURFs, have the ability to enact management regimes to create and enforce limits on extractions. Stronger enforcement of the extraction rules costs users more money than weaker enforcement of regulations, so the profit function for CPR users becomes:
![\[\text { Profit }_j=\alpha x_j-x_j\left(\beta X_j\right)-\text { Management } \text { Cost }_j.\]](https://www.thecgo.org/wp-content/ql-cache/quicklatex.com-2d30cb110bcf96221e5bab68a76b0fa3_l3.svg "Rendered by QuickLaTeX.com")
 represents the cost to each player to provide the given level of management for their group’s CPR
  .
.
Finally, we also allow for individual violations of account extraction regulations to be punishable by a fine on the individual. Since extracting benefits you privately and the costs are shared with everyone else extracting from the CPR, there is an individual incentive to extract more. The socially optimal level balances the benefits and costs for the group, but cheating by extracting more while everyone else cooperates and extracts at the socially optimal level earns you more money. It is therefore in your personal interest to extract more while everyone else extracts at the lower level. The fine in our experiment is set to the profit a user gains by extracting at the optimal cheating level,  , when everyone else in their group extracts from
  at the socially optimal level,
  .
.
(14) 
where  for user .
 is found by solving as we have above, but without symmetric actions by all the agents.
Therefore,  Accounting for a fine of a proportion of your profits,
 we have
![Profit_{ij} = (1 - \theta)[\alpha x_{j} - x_{j}(\beta X_{j}] - Management Cost](https://www.thecgo.org/wp-content/ql-cache/quicklatex.com-d7ebfb51afaf9d4661d92afecdf64b17_l3.svg "Rendered by QuickLaTeX.com") (15)
(15)
if is found violating the extracting limit each period, and
 (16)
(16)
if is not found violating the limit.
The model represents a fishery where fishers spend their time ( units) working in the fishery (harvesting  fish per unit of time) or pursuing outside labor (earning per unit of time). Fish are sold on the market place at a set price (
 ), but the cost to catch fish increases the more time others spend harvesting from the fishery (
 . A united, outside-managed group account represents the centralized government-managed fishery. Divided self-managing group accounts represent a TURF setup.
Assuming symmetric outcomes, management and fines do not change the Nash Equilibria.
If  is below the extracting limit for the CPR, there is no risk of a fine
  and is unaffected by the presence of management.
The socially optimal extraction level is the same with management as without management.
 The presence of a management regime punishing other-group extracting affects
  . But the effect does not impact your optimal other-group extraction. The other-group extraction amount from before the introduction of management is still optimal.
For both united groups and divided groups, the presence of management and fines does not impact the optimal harvest.
Without management, and in a united group’s account, or in each group account for divided groups. Under management, we derive the same result as without management, but multiplied by a constant. The constant falls away when we identify the Nash Equilibrium and socially optimal extraction levels.
The presence of management does not impact the Nash Equilibrium extraction level. Management also does not impact the socially optimal extraction level.
Experimental Design and Procedures
A total of 108 undergraduate and graduate students were recruited at a public university in the United States and paid based on their performance in the game.2A total of 120 students were recruited, but 2 participants left their Sessions a couple Periods before the end. They left descriptions of their strategies and activities in the game up to their departure, and gave instructions on how the experimenter should play the game from their computer after they left. These instructions were detailed, and gameplay continued seemingly uninterrupted for the final Periods. We remove the subjects’ data and the data from the rest of the members of their united group or divided groups (for the entire Session) from the analysis due to concerns regarding validity. We therefore report findings from the remaining 108 players. Including the full sample gives comparable results to what we report, but with higher statistical power. Participants played two Cycles of the game in the fall of 2018. A Cycle is 10 Periods of the same fishery game under the same management regime (outside management or self-managing). To prevent order effects the order participants play management treatments in is randomized. The experiment was conducted using the software z-Tree (Fischbacher, 2007). Participants received a show-up fee of $10 and the average payout at the end of the game was $18.92. The payout was based on each Experimental Dollar earned by participants being worth $0.01 USD. 56.25% of participants were female, the average grade level of the students was a junior, and the majority of participants had not previously participated in an economic experiment.
One-half of experiment Sessions have participants play the game in united groups with a large group account shared by 6 people. The other half of Sessions have players in groups of 3 people who share smaller accounts and can interact with the group account of another group of 3 people. Group members can only extract tokens from their account in the united groups. Players are able to extract a certain number of tokens legally from their group’s account, but they can also illegally extract above the legal limit. Players in the divided group treatment have the additional option to extract from the other group’s account illegally. We call the act of extracting tokens from the other group’s account “poaching.”
To begin their experiment Session, each player discovers whether they are in a united group of 6 people or in a divided group with 3 people. The players answer a short demographic survey (their major, gender, grade level, and experience with economic experiments), complete 3 questions confirming their comprehension of the game, and begin playing the first Cycle.3The order of the Session elements was set based on feedback from a pilot Session. Participants play both management treatment Cycles (in random order) and finally are paid for participating in the experiment. All decisions made in the game are anonymous.
The experiment is a Common Pool Resource game similar to Abatayo and Lynham (2016). Each Period the group members decide how many tokens to extract from a “group account” (the CPR of the model) they share with either 2 or 5 other group members. They have an endowment,, to spend each Period either extracting tokens or performing an outside activity (an activity paying a set amount). We set the amount from the outside activity,, to zero, so players only earn Experimental Dollars from the tokens they extract.
The profit earned each Period is a constant individual payoff from each token minus a term accounting for total extraction from the account in the Period and the user’s share of the total. The extraction of each individual is simplified to  and total extraction by everyone else in the group account becomes
  . The strategy set for users is between 0 and in each time Period.
In the experiment we parameterize the model with specific values, allowing us to assign numerical values to the equilibria.  , ,
, ,  ,
,  and
and  in divided groups and in united groups.
  is half as large in united groups as in divided groups to reflect the greater relative impact the removal of a token has in a smaller account. Imagine the 6-person group setup represents an entire united fishery and the two 3-person group setup represents a larger fishery divided into two sub-fisheries. Removing one fish in an ecosystem encompassing half of a fishery is twice as impactful to the other fishers there as it would be to the fishers in a whole fishery; hence the difference in s.
Simplifying the general extraction at Nash equations of the model, (6) and (7), leads to  and
and  , together totaling 17.14 tokens. The results suggest a strategy of extracting 8.57 tokens from your group’s account and poaching 8.57 from the other group’s account. However it does not consider the management regime, which could alter the ideal exact distribution of tokens.
For united groups,  , and there is only one account. We therefore solve
  .
.
Total group extractions at the Nash level are  for the united group and 51.43 for each CPR in the divided group setting (102.86 total).
Parameterizing the socially optimal extractions for the divided group accounts (Equations (12) and (13)) gives  and
and  , leading to a total
  ,
,  .
.
For united groups with 1 account we have , also with .
Both group size treatments have the same socially optimal and symmetric Nash Equilibrium extraction levels. United and divided group members extract 17.14 tokens in total at the Nash Equilibrium. The socially optimal individual extraction level is 10 tokens for both divided and united groups.
The socially optimal total extraction,  , is 60 tokens (each divided group account has a total socially optimal extraction of 30, and both together is a total socially optimal extraction of 60 tokens). Players earn 75 Experimental Dollars extracting at the socially optimal level.
Total Nash Equilibrium extraction is (again, summing up the extractions of two groups of 3 people or a single united group of 6 people). Players earn 36.75 Experimental Dollars extracting at the Nash level. Nash extraction for divided groups is identical to united groups because both group treatments occupy systems with 6 users and utilize accounts with s proportional to their fraction of the overall system.
Management and Fines
The next aspect of the experiment reflects the presence of externally provided resource management or
the self-provision of management. In half of a Session’s treatments the management regime is set outside the group by the experimenter (representing the role of the government in a typical real-world fishery). The outside management sets a limit, or “cap,” on how many tokens each individual user can legally extract from their group account each Period. The cap represents a fishing limit. Anything you extract above your cap is considered illegal and there is a percentage chance your illegal extracting will be discovered. The chance of being found is the “level of surveillance.” Managed users pay a set fee each Period to cover the costs of the regime and are told the cap and level of surveillance at the start of each Period. Self-managing groups democratically choose the cap and the level of surveillance before making extraction decisions. Stronger enforcement of account regulations costs users more money than weaker enforcement of regulations.
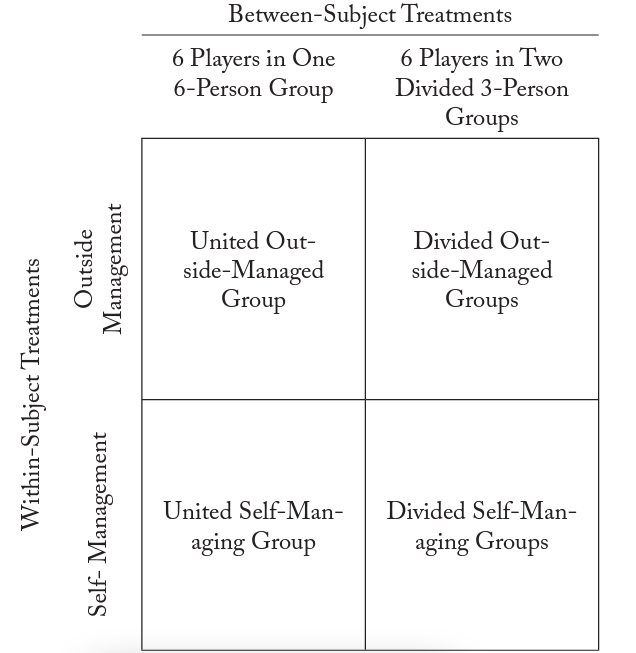
Our design is a classic 2×2 experiment (Table I). The control of players over harvest limits and enforcement is the within-subject treatment. Whether the group account is split into two divided sub-accounts or kept together in a united account is the between-subject treatment.
Table I. The experimental design
In-game violations of account extraction regulations are punishable by a fine. Cheating by extracting more while everyone else cooperates and extracts at the socially optimal level earns you the highest amount of Experimental Dollars. The model’s fine is set to the profit a user gains by extracting at the optimal cheating level, , when everyone else in their group extracts at the socially optimal level. See Equation (14).
When extracting in the outside-management treatments, players are told they can extract up to and including 12 tokens from their group’s account legally.4Figure A1 in the Appendix shows a representative screenshot of the extraction decision screen players see in the game. If you harvest above the “cap,” there is a 10% chance the computer will find you harvesting above the cap and will assess you a penalty of 25% of your profits. The cap and percentage chance of being fined were chosen based on the methods and results found in Abatayo and Lynham (2016). Both our experiment and theirs select them because the set cap is just above the social optimal level (10 tokens) and the level of surveillance (10%) is too small to discourage uncooperative behavior. Furthermore, the cap and surveillance level are almost identical to the average cap and surveillance level participants in an unpaid pilot Session chose. In a similar experiment, the level of surveillance is set at 11.1% for almost identical reasons to ours (Chávez et al., 2018).
In the self-managing treatments, before the players make any decisions about harvesting, they discuss and vote on the management regime. Each Period they first communicate with their group members during a 2-minute chat. A chat feature in the z-tree software allows players to type and send instant messages anonymously.5Figure A2 in the Appendix shows a representative screenshot of the chat screen self-managing players see in the game. After 2 minutes they see a screen where they vote on the cap for the Period.6Figure A3 in the Appendix shows a representative screenshot of the screen self-managing players see in the game when entering their vote for the harvest cap for their group account in the upcoming Period. The median vote from the group is chosen to be the cap. After voting on the cap concludes, the players see a similar screen where they vote for the level of surveillance for the Period. They choose a level from 0-50% in 10% increments and the median vote from the group is the level chosen. The surveillance level determines the percentage chance the computer will discover someone exceeding the cap, or someone from the other group who is poaching from your group’s account. If the computer discovers you, you are fined 25% of your profits. The fines collected do not go to the players but go to the computer. Each level of surveillance has a cost that is assessed to each player (Table II). The levels increase in cost so there is realistic diminishing returns from surveillance. Our endogenous management construction is the same as Abatayo and Lynham (2016).
Table II: The costs of different levels of enforcement effectiveness participants see.
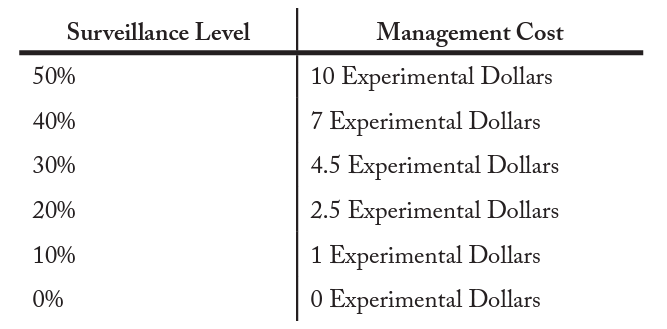
The levels of surveillance self-managing players can select are chosen based on the levels in Abatayo and Lynham (2016) and the maximum abilities of fisher collectives to surveil their fishing grounds in the developing world. The range allows us to examine cooperation and management decisions in settings where enforcement is weak. 0% is the minimum an account could be surveilled, 50% is the maximum percentage chance to intercept someone illegally fishing. 50% is the most real-world TURFs could expect to surveil. Fisheries are almost always at an even lower surveillance level (Delgado et al., 2003; Sutinen and Kuperan, 1999). In addition to low surveillance levels, most fisheries have relatively small fines.
In both outside management and self-managing treatments the penalty for violating regulations is confiscating 25% of an illegal fisher’s profits. The penalty in the experiment is based on the value in Abatayo and Lynham (2016), reflects the relatively low penalties most fishery managers render, and represents penalties which are too low to effectively discourage illegal fishing (Sutinen et al., 1990).
Players in the self-managing united groups have full communication between all the relevant resource users. Self-managing divided groups have only partial communication between all the relevant users (players can communicate with their own group members, but not with members of the other group who can poach from their account).
Using the parameters we set for our experiment,  and therefore we set
  (100-75). Since users are never able to change the size of the fine, the fine is never more than 25 Experimental Dollars. Since we do not allow for the 100% possibility of being discovered violating the regulations, a chance of being fined equal to the profit from violating is not large enough to deter rational users.
The fine is not large enough because the maximum you can earn from cheating is 25 Experimental Dollars, the fine will only equal 25 Experimental Dollars when you are caught optimally cheating and everyone else cooperates. Additionally, taking into account the chance of being fined, the expected fine will always be lower than 25 Experimental Dollars so a risk neutral user would not be deterred by the fine.7 The fine is not large enough because the maximum you can earn from cheating is 25 Experimental Dollars, the fine will only equal 25 Experimental Dollars when you are caught optimally cheating and everyone else cooperates. Additionally, taking into account the chance of being fined, the expected fine will always be lower than 25 Experimental Dollars so a risk neutral user would not be deterred by the fine. If self-managing users choose the maximum level of surveillance available, 50%, a fine of 25% of your profits for breaking the management rules is too low to effectively deter poaching. Thus we create a setup for weak enforcement of rules. We create a regime with weak enforcement because weak enforcement is the norm in most fisheries (Sutinen et al., 1990). Other experiments follow similar procedures (Abatayo and Lynham, 2016; Chávez et al., 2018).
Accounting for the fine, we have the following profit functions for extracting from your group’s CPR: ![Profit_{j} = 0.75[15x_{j} - x_{j}(\beta X_{j})] - Management Cost_{j}](https://www.thecgo.org/wp-content/ql-cache/quicklatex.com-06b8afc6ae06b390032336e23f9e9373_l3.svg "Rendered by QuickLaTeX.com") if a user is found violating the cap, and
if a user is found violating the cap, and  if a user extracts below or at the extraction cap.
Under our outside management regime, the socially optimal extraction strategy is to extract 10 tokens from your own group’s account. Following the strategy maximizes total wealth for the group, but it is not an equilibrium as it is always better for the individual to harvest 11 tokens than 10. With a management regime consisting of a cap of 12 and a surveillance level of 10%, the total socially optimal extraction amount for an individual, , is below the cap. Each token you extract from the other account is at a 10% risk of being fined. Therefore the expected utility from a token harvested from your group’s account (with zero chance of incurring a fine) is higher and you will extract all the tokens from your group’s account.
 + (0.90)[\frac{\partial Profit_{l}}{\partial x_{l}}] \leq [\frac{\partial Profit_{j}}{\partial x_{j}}] when x_{j} \leq 12](https://www.thecgo.org/wp-content/ql-cache/quicklatex.com-d646434c6caeb635e018a48c6aee5bcd_l3.svg "Rendered by QuickLaTeX.com")
The overall socially optimal harvest level is the same under management as it is without. The management regulations merely adjust where individuals harvest their 10 tokens between CPRs in the divided setting.
The socially optimal harvest is also below the cap for the united groups and so management has no effect on the socially optimal harvest amount in united settings.
Assuming symmetric outcomes, we can see that management and fines do not affect the Nash Equilibrium. With a Nash Equilibrium above the cap, players extracting at the Nash level are at risk of being fined.
Under outside management, the Nash Equilibrium harvest in the united groups is the same as we found without considering management, .
.
Under outside management, the Nash Equilibrium spatial distribution of token extraction for divided groups between both CPRs is the same as without the management program. is unaffected by the presence of management when your own-group extraction is below the harvest cap. Since the distribution of tokens without management is 8.57 in each account, below the own-group cap of 12, the cap does not impact your extraction from your own-group account, and the same own-group extraction is optimal.
is affected by the presence of management. But the effect does not impact the optimal harvest level,  , because extracting 8.57 tokens from the other group’s account maximizes your discounted profit function without management and fines. The possibility of being fined for extracting from the other group merely acts as a constant multiplied by the profit function. Players still maximize their profit by extracting at the same level. Therefore extractions from the two accounts remain symmetric between them at the same levels as they were when there was no management regime.
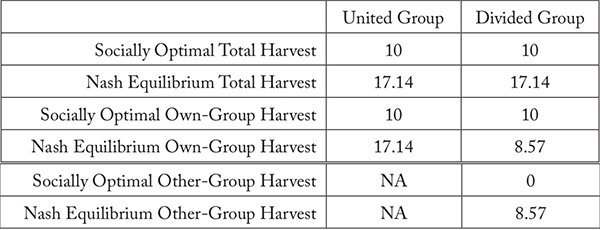
The presence of management and fines do not impact harvests at the Nash Equilibrium. United group members harvest the same number of tokens under management as they do without management. Similarly, divided group members at the Nash Equilibrium harvest the same number of tokens from their group and from the other group under management as they do without management. Since united groups and divided groups harvest the same overall amounts as each other in the Nash Equilibrium and have identical socially optimal harvest levels, and management and fines do not introduce any differences, we should not see any differences in harvests between united groups and divided groups (Table III). Behaviorally based concepts and explanations such as groupiness would better explain any differences in harvests we observe.
Table III: The harvest levels the model predicts for the group size treatments.
Our experiment design enables us to examine the effects of TURFs—specifically the self-management, and the level of decision-making devolution and inter-TURF aspects—on profitability, sustainability, responsibility, and criminality.
Hypotheses
The experimental design allows us to test the hypotheses that group division and self-managing will impact outcomes. Impacts will suggest the presence of behavioral factors TURF proposals need to consider before implementation.
In the absence of such behavioral factors, there should be no difference in extractions between a large united group and two smaller divided groups. Theory, our model, and the specific parameterization of the experiment predict there will be no differences. Both group setups have a socially optimal extraction amount of 10 tokens per individual and a Nash Equilibrium amount of 17.14 tokens per individual.
Hypothesis 1: Cooperative and sustainable behavior of divided groups will be statistically significantly different from behavior of united groups.
We test Hypothesis 1 using the number of tokens harvested, players’ profits, management regimes (the levels of surveillance and harvest caps set), and regulation violations (the frequency and magnitude of violations of caps).
Despite predictions by models of group decision-making, the theory of TURFs is highly dependent on behavioral factors like fishers feeling more invested in locally made decisions than decisions made at more distant levels. Because individuals in smaller group sizes feel more empowered to impact their outcomes (Agrawal and Goyal, 2001), smaller divided groups may feel the regulations and outcomes are more responsive to group members and outperform larger united groups. Poaching activity from outside the group may mitigate the effect by introducing a force in the divided groups’ environments they do not feel able to control. Users who do not feel able to have an impact may not behave in a socially optimal way and could behave selfishly. However, the poachers merely replace other group members from the 6-person united group setup. Players in divided groups should still feel more empowered in their smaller group. Our specific design of dividing groups allows us to explicitly test the idea of “groupiness” by measuring cooperative behavior toward own-group players and non-cooperative behavior toward other-group players. The experiment directly compares predictions of group theory and behavioral precepts of TURF theory in describing observed behavior.
Previous work regarding endogenous enforcement decisions and management in shared resource management experiments indicates endogenously determined rules are more effective and followed more regularly than exogenously imposed rules attempting to achieve efficient management. Villena and Chavez (2005) go so far as to suggest TURFs will be unable to avoid overharvesting without endogenous regulation. Research indicates our results will be in line with the hypothesis below.
Hypothesis 2: Self-managing groups will report statistically significantly different measures of cooperative and sustainable behavior from outside-managed groups.
We will test Hypothesis 2 using the numbers of tokens harvested, the players’ profits, the levels of surveillance and harvest caps set, and the frequency and magnitude of violations of set harvest caps. We expect self-managing groups to show lower token harvests, higher profits, higher levels of surveillance and lower harvest caps set than by outside management, and lower frequencies and magnitudes of regulation violations.
Results
Summary statistics find self-managing groups outperform outside-managed groups and united groups outperform divided groups. For each dependent variable we report the findings of our preferred random effects regression model,8Previous experimental research uses random effects rather than fixed effects (Abatayo and Lynham, 2016; Chávez et al., 2018) and diagnostics indicate random effects are better in our context. Running identical models under fixed effects gives very similar coefficients on our variables of interest. or logistic regression model for a specific aspect of rule violations, as a robustness check and for further exploratory analysis. Compared to outside-managed players, self-managing players harvest fewer tokens (thus increasing their incomes) and choose higher levels of surveillance to catch illegal harvesting than our outside management regime. Divided group players harvest more tokens than united group players, resulting in lower incomes for them. United group members harvest more tokens (13.99) from their own group account on average than divided players (11.31) and extract 3.31 tokens over the cap when they break the cap. Cap breakers in divided groups only take 1.86 tokens over on average. However, because divided-group members also poach, they extract more tokens overall than united-group members (16.81 tokens versus 13.99 tokens).9Figure A4 in the Appendix provides another way to visualize the data, graphing the profit earned by token extraction while also identifying the average total harvest levels and profits in each treatment. Additionally, united groups choose lower harvest cap management regimes. Inter-TURF effects are larger than the effects from allowing players to communicate and self-manage. Our regressions confirm the findings in Table IV.
Table IV: The average values of variables from the experiment. The Divided and United columns report values from Self-Managing and Outside-Managed groups averaged together. The Self-Managing and Outside-Managed columns report values from Divided and United groups averaged together. The Nash and Social Optimal harvest levels are derived theoretically and presented to compare with the findings of the experiment. The averaging of values is at the individual level and the values we report are for an individual unless otherwise noted. The Percentage of Group Exceeding Cap is at the group level. The Surveillance Level and Cap Chosen rows only report values from self-managing groups at the group level. There are 320 observations at the group level and 960 at the individual level. There are 5 Sessions for each group size treatment and 10 for each management treatment. 108 people participate in the management treatments and 54 participate in each of the group size treatments. P-values reports results from Wilcoxon rank sum tests.
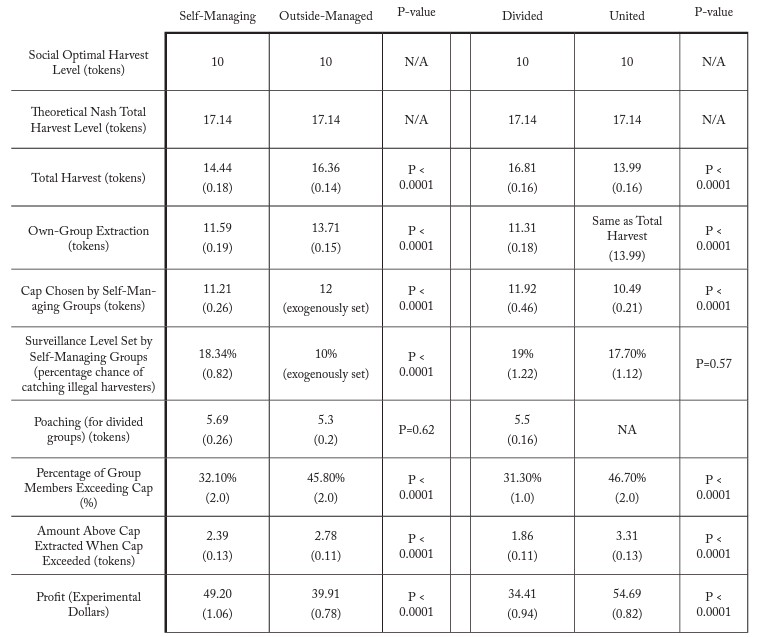
Mann-Whitney statistical tests find significant differences in means between treatment groups. We find that the differences in mean total harvest, own-group extraction, cap selection, percentage of group exceeding the cap, amount above the cap extracted, and profit between group size treatments and management treatments are statistically significant at the 1% level using a Mann-Whitney two sample statistic test. Differences in mean surveillance levels chosen and poaching amounts are not statistically significant.
Our larger united groups exhibit a stronger impact from self-managing and communicating than Abatayo and Lynham’s smaller groups report. The average extraction in Abatayo and Lynham’s 3-person united groups is 12.03 for self-managing able to communicate and 13.64 for outside-managed groups unable to communicate.10In their paper, Abatayo and Lynham divide their results by Session Cycle. The per-Cycle average token extractions they report are 13.21 (0.64) in the first Cycle and 10.84 (0.37) in the second Cycle for endogenous management. For exogenous management they are 13.05 (0.65) and 13.26 (0.64) for rules generated by another group unable to communicate, and 13.58 (0.38) and 14.68 (0.48) for rules generated by another group able to communicate. The average extraction in our self-managing united groups of 6 people is 12.76 (0.22) tokens, and the average for our outside-managed united groups is 15.22 (0.21). Larger united groups experience a greater positive impact from being able to communicate and set their own management regime.
If we only examine the harvest behavior within our outside-managed groups, we find a difference in average total harvests that is unrelated to the communication effect Abatayo and Lynham describe. Outside-managed divided groups harvest 16.12 tokens but outside-managed united groups harvest 12.76 tokens.
Users’ Incomes
The profits of players in the united groups are consistently larger than those in the divided groups. Players in divided groups earn 20.28 Experimental Dollars less each Period than members of united groups (Table IV).
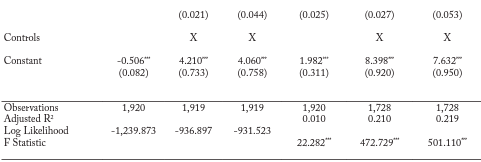
Self-managing players earn 9.29 Experimental Dollars more overall than outside-managed players (Table IV).Table V confirms this pattern and identifies a temporal aspect where outside-managed players exhibit decreasing incomes over time. Each Period of the game outside-managed players earn 1.08 Experimental Dollars less than the previous Period (Table V Column (3)).11Self-managing players earn an additional 0.43 Experimental Dollars each period, but the amount is not statistically significantly different from 0. The pattern holds over all the Periods participants play after the first Period.12Figure A5 in the Appendix shows the temporal pattern the main text describes. But while the overall effect is economically significant, the difference in incomes is not as large as the difference between divided and united groups (16.64 Experimental Dollars each Period in our preferred model, Table V Column (3)).
Table V: Incomes
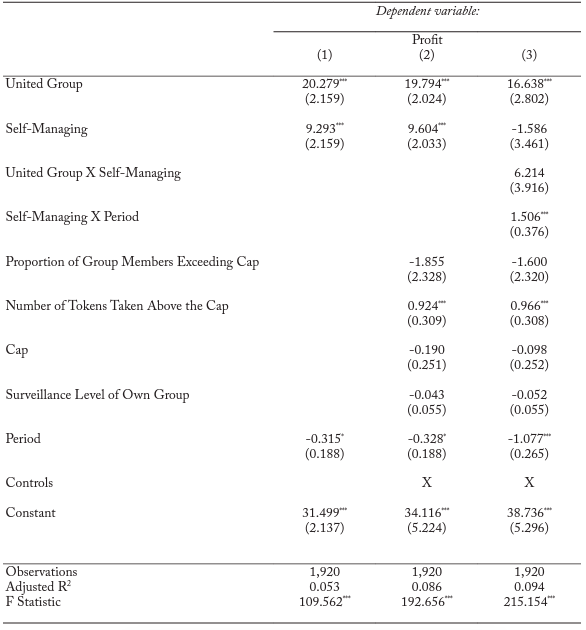
Note: *p<0.1; **p<0.05; ***p<0.01 Random effects regression model results shown with per Period profit per fisher in Experimental Dollars as the dependent variable. Analysis is at the individual level. Robust clustered standard errors by group, Cycle, and Session are in parentheses. Self-Managing indicates whether subjects can communicate and then vote on the cap and surveillance levels of their group account. Controls indicates whether the control variables are present in a regression. The controls we use are the Cycle of the experiment (to control for any order or learning effects), two dummy variables indicating if a participant’s area of study is biology or environmental economics, a dummy variable indicating if a participant is female, grade level, and the participant’s prior experience with economic experiments.
Harvest Behavior
Individuals in self-managing groups harvest less each Period while outside-managed individuals harvest more each Period. Poaching leads to higher total harvests, and since poaching only occurs for divided groups it drives the difference in harvests between the group treatments. Table VI gives a breakdown of the important covariates affecting harvesting.
Table VI: Harvesting
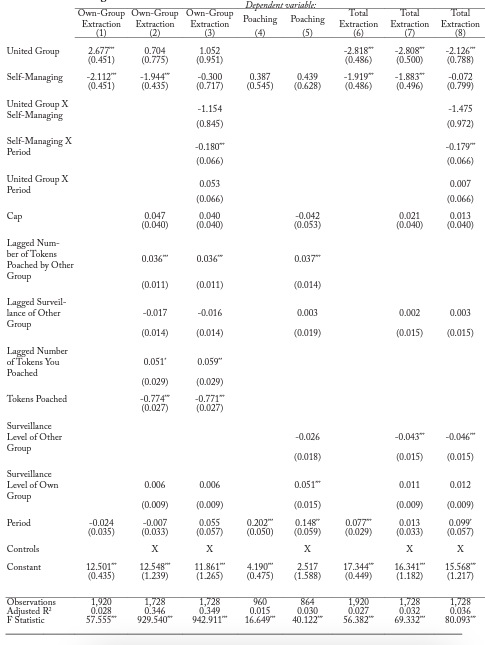
Note: *p<0.1; **p<0.05; ***p<0.01 Random effects regression model results shown. Analysis is at the individual level. Columns (1), (2), and (3) report regression results for token extraction from your own group account as the dependent variable. Columns (4) and (5) report regression results for token extraction from the other group’s account as the dependent variable. Columns (4) and (5) restrict the sample to include only individuals in the divided group treatment, since only those individuals can poach. Columns (6), (7), and (8) report regression results for total token extraction from both your account and the other group’s account (for divided groups) as the dependent variable. “Lagged” indicates the value of the variable in the previous time period. Robust clustered standard errors by group, Cycle, and Session are in parentheses. Self-Managing indicates whether subjects can communicate and then vote on the cap and surveillance levels of their group account. Controls indicates whether the control variables are present in a regression. The controls we use are the Cycle of the experiment (to control for any order or learning effects), two dummy variables indicating if a participant’s area of study is biology or environmental economics, a dummy variable indicating if a participant is female, grade level, and the participant’s prior experience with economic experiments.
Table VI Column (3) shows united group members extract more from their group account, supporting the findings of Table IV. Though there is a significant effect in Column (1), at first glance it may appear there is no difference between the group treatments in Columns (2) and (3). However, looking at the coefficient on Poaching, we see the driving force behind the significant, positive coefficient on United Group in Column (1). In a divided group you can poach from the other group’s account. There is nowhere else to extract from in the united groups. Poaching acts as an escape valve for own-group extraction, though previous poaching and poaching by the other group raise you own-group extraction a little. Poaching necessarily externalizes token extraction, giving the appearance of higher harvests in united groups. The total tokens united groups harvest may not necessarily be larger than the totals divided groups harvest if we take poaching into account, as we do in Columns (6)-(8). Meanwhile, self-managing decreases extractions from your group’s account each Period (Column (3)).
Table VI Column (5) indicates the amount the other group poached from your group’s account, the level of surveillance for your group account, and time raise your extraction from the other group’s account. Theory predicts high poaching levels will encourage higher extractions from your own account and from the other group’s account. Theoretically, violations by others lead to more violations by you because compliance with rules is frequently a result of you believing other people will comply as well (Young, 1979). Communicating and voting with other group members about management could increase your belief group members will cooperate. We see this in own-group extracting behavior, where self-managing leads to lower harvests over time. While you could just extract less from your account and poach more from the other account, we see no pattern of self-managing impacting levels of poaching. However, higher poaching by the other group leads to you poaching more. Another interesting finding is that, the higher the probability that you would be caught if you broke your group’s harvest cap, the more you will extract from the other group. This suggests that higher surveillance levels displace extraction behavior spatially between accounts.
Combining own-group and out-group harvest, divided groups harvest more tokens overall than united groups, while outside-managed groups harvest 0.099 more tokens each Period and self-managing groups harvest 0.179 fewer tokens each Period than the previous one. Both management groups harvest statistically similar levels initially (Table V Column (8)). Because united groups do not have another group’s account to extract from – like divided groups do – a more accurate measure than own-group extraction is the total number of tokens you harvest. Total harvest is your extraction from your united group’s account, or the sum of your extraction from your group’s account and another group’s account for divided group members. Smaller groups lead to more cooperative behavior with your group members (lower own-group harvesting). But the cooperation is subsidized by non-cooperative behavior toward the other group (more poaching), fitting the idea of groupiness. The result is higher overall levels of harvesting.
Table IV shows that the average total harvest of united groups is 2.82 tokens lower than the average in divided groups and that self-managing reduces average token harvest by 1.92 tokens overall.
Management and Enforcement
Table VII indicates united groups choose lower harvest caps and self-managing groups choose higher surveillance levels than the suboptimal level the government provides. United groups choose caps 1.42 tokens lower than divided groups on average (Table IV).The number of tokens the other group previously poached from your account lowers the cap you choose, indicating groups attempt to choose optimal caps in the face of external extracting. The higher the surveillance level the other group chose the previous Period, the higher the surveillance level your group chooses (Column (5)). A 10% increase in the other group’s surveillance level leads to a 2.69% increase in the surveillance your group chooses the next Period. Players may worry the other group’s higher surveillance will cause members of their group to harvest more from their own account next Period because they anticipate the surveillance will be too high next Period to safely poach. Therefore a higher surveillance level by the other group encourages your group to set a higher surveillance rate to prevent a rush of own-group extracting. The average surveillance level all self-managing groups choose is 18.34% (Table IV ). 10% is the level outside management provides. T-tests confirm that self-managing groups are statistically different from outside management in terms of the caps and levels of surveillance they choose (Table IV).
Table VII: Management Regime
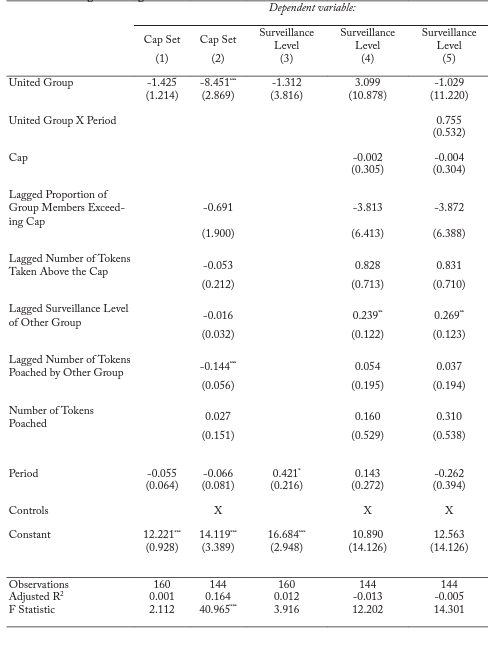
Note: *p<0.1; **p<0.05; ***p<0.01 Random effects regression model results shown. Analysis is at the group level and restricted to self-managing groups. Columns (1) and (2) report regression results for the harvest cap the group selects as the dependent variable. Columns (3), (4), and (5) report regression results for the surveillance level the self-managing group selects as the dependent variable. ‘Lagged’ indicates the value of the variable in the previous time period. Robust clustered standard errors by group, Cycle and Session are in parentheses. Controls indicates whether the control variables are present in a regression. The controls we use are the Cycle of the experiment (to control for any order or learning effects), two dummy variables indicating if a participant’s area of study is biology or environmental economics, a dummy variable indicating if a participant is female, grade level, and the participant’s prior experience with economic experiments.
Comparing our self-managing, united, 6-person groups to Abatayo and Lynham’s self-managing, united, 3-person groups, we find our united groups choose comparable harvest caps, but significantly higher surveillance levels. The groups in Abatayo and Lynham choose an average cap of 10.30 (0.58) and a surveillance level of 5.13% (2.45). Our groups choose a cap of 10.49 (0.21) and a surveillance level of 17.70% (1.12) (Table IV).
Illegal Activity
Summary statistics indicate united group members are more likely to extract more from their group account than the cap (Table IV). The difference is about 1 member violating in divided groups compared to 3 members in united groups. Besides more frequently violating the cap, they extract statistically significantly more tokens (1.45 more) when they break the cap than divided group members do when they break the cap (Table IV).This is unsurprising given divided groups can use their effort to extract from another group’s account instead of their own.
However, united groups may not necessarily be more felonious; “groupiness” may explain our findings. In Table VIII united group members appear to show lower levels of harvest cap violations than divided group members. Poaching behavior drives the difference between the coefficients on United Group in Table VIII (Columns (2) and (3)) and our summary statistics. The more you poach the less likely you are to break the cap and when you do you harvest less above the cap. Divided players poach an average of 5.5 tokens. Given the coefficient on the poaching variable (Column (3)), the effect from poaching more than offsets the effect from United Group saying they violate their cap less frequently. The pattern suggests poaching is a substitute for own-group harvesting (a pattern the coefficient on United Group in Column (1) supports), illustrating the concept of “groupiness.” Smaller group sizes in the divided treatment lead to more cooperative behavior within your own group, cooperation that is subsidized by non-cooperative behavior toward the other group. In fact, because poaching significantly explains whether you violate your own group’s cap, our results directly follow the idea of groupiness.
Table VIII: Regulation Violations
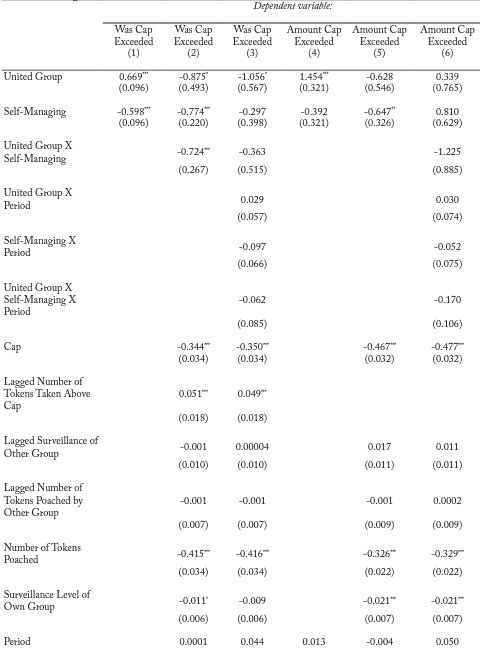
Note: *p<0.1; **p<0.05; ***p<0.01 Random effects regression model results shown for Columns (4), (5), and (6). Columns (1), (2), and (3) report logistic regressions. Analysis is at the individual level. Columns (1), (2), and (3) report logistic regression results for whether a subject exceeds the cap for the group account as the dependent variable. Columns (4), (5), and (6) report regression results for the amount that the group exceeded the cap as the dependent variable. Self-Managing indicates whether subjects can communicate and then vote on the cap and surveillance levels of their group account. ‘Lagged’ indicates the value of the variable in the previous time period. Robust clustered standard errors by group, Cycle, and Session are in parentheses. Controls indicates whether the control variables are present in a regression. The controls we use are the Cycle of the experiment (to control for any order or learning effects), two dummy variables indicating if a participant’s area of study is biology or environmental economics, a dummy variable indicating if a participant is female, grade level, and the participant’s prior experience with economic experiments.
Without considering interaction effects, self-managing group members break the cap less, and when they do they break it to a smaller extent (Columns (2) and (5)). But when interaction effects are considered, being involved in management decision-making has no impact on your likelihood to violate the cap you just voted on (Column (3)). Unsurprisingly, higher caps lead to fewer and smaller violations of the cap. More individuals break the cap in the second Cycle than in the first, and when they do they harvest more than cap breakers in the first Cycle. Higher levels of surveillance lead to fewer tokens taken above the cap, and discourage players from breaking the cap without considering interactions (Columns (2) and (5)).
Self-managing a shared Common Pool Resource improves measures of user incomes, resource extraction amounts, and the management programs enacted while dividing a shared resource and its users into smaller groups lowers such measures. Self-managing groups have lower token harvest levels, greater levels of rule enforcement, and higher profits. United group accounts experience lower harvest levels, their members choose more responsible management parameters, and they are more profitable than divided group accounts. While divided groups are more cooperative within their smaller groups, they exhibit a larger degree of non-cooperative behavior outside their group, raising their overall harvest levels and lowering their collective incomes. Groupiness can explain the patterns of behavior we see. In Tables AI and AII of the Appendix we search for learning effects by completing our management, enforcement, illegal activity analyses for only the first Cycle of the game participants play. We do not find learning unexpectedly and significantly biases our results.
Discussion
For TURFs, our experiment suggests self-managing improves fishery outcomes while dividing fishers reduces outcomes. Our experiment measures fisher incomes, fish harvests, the management regimes fishers implement, and illegal fishing. Our results are in line with Hypothesis 2, “Self-managing groups will report statistically significantly different measures of cooperative and sustainable behavior from outside-managed groups.” Incomes are 23% higher for self-managing fishers than for outside-managed fishers on average. Furthermore, self-managing groups choose higher levels of surveillance than the sub-optimal level our outside management provides. Our findings also follow the predictions of Hypothesis 1, “Behavior of divided groups will be statistically significantly different from behavior of united groups.” Fishers in divided fisheries harvest more and earn less. Incomes are 37% lower in divided fisheries than in united fisheries. United fishers harvest less, select lower legal harvest limits, and are more profitable than divided fishers. Since the group treatment effect is larger than the management effect, our results indicate fisheries managed by traditional central authorities will report better outcomes than decentralized self-managing fisheries overall.
Finding positive impacts of self-management and communication follows others in the literature (Viteri and Chávez, 2007). The findings are encouraging for TURFs because the concept depends on self-management of resources. However, in our experimental design, outside management is always set to suboptimal levels. In reality outside management can be set at levels better than the levels our self-managing groups select. Further work needs to analyze results when outside management is set to more optimal levels. Additionally, it is important to remember Abatayo and Lynham (2016) and Hayo and Vollan (2012) argue user communication is the deciding factor for efficiency, more than whether the management was exogenous or endogenous. Finally, before applying our results to policy-making, decision-makers must remember that in addition to success stories there are also many cautionary tales of self-management programs failing in the real-world (Estrin, 2010; Ness and Azzellini, 2011).
TURFs frequently divide a fishery and fishers into subgroups based on spatial areas, but our research indicates division will lead to suboptimal outcomes. Theoretically there should be no difference in the extraction patterns between our united and divided group treatments (Bramoullé et al., 2014; Bramoullé and Kranton, 2015). However we see different results due to behavioral reasons. The act of separating a single group of people into two groups creates a feeling of otherness toward the other group, and “groupiness” develops (Diehl, 1990; Kranton et al., 2018). Once the other group is seen as an “other,” participants no longer see them as people to cooperate with, but people to compete with and exploit. Other experiments find similar results. An experiment dividing people merely based on which of 2 paintings they prefer finds group bias forming and subjects treating people in the other group differently than members of their own group (Kranton et al., 2018). Identity economics appears to be the major cause for the results seen between our two group treatments. Our experiment showcases the importance of identity in economic outcomes (Akerlof and Kranton, 2011).
Our results are consistent with the communication effect Abatayo and Lynham report, but the effect from groupiness and identity appears even after controlling for the management regime of players. Overall, self-managing groups able to communicate and select their management regime extract fewer tokens and earn more money. The difference shows the direct impact of groupiness on extraction behavior. Groupiness leads players in outside-managed divided groups to display more cooperative behavior toward their own group members in the smaller groups, by extracting fewer tokens and violating own-group rules less frequently. However groupiness also leads players to display non-cooperative behavior toward the other divided group, by poaching from the other group’s account. Since the poaching levels are higher than the reductions in own-group harvesting, the net effect is higher levels of overall harvests. The effect persists regardless of any change in management and communication: divided groups always harvest more than united groups. There previously had not been analyses of groupiness and “us versus them” dynamics in TURFs; we report some of the first findings of the effects.
Future research can determine specifically why dividing fisheries lowers outcome measures. The losses suffered by our groups when a large united account was split into two divided accounts show divided group management operated at an inappropriate scale. Is fishery management by many smaller groups suboptimal to management by fewer larger groups? Or is the negative impact simply a result of management and communication being at an inappropriate scale that did not include all the relevant fishers within the group? The first explanation suggests negative impacts could be the result of groupiness. But Chávez et al. (2018) and De Geest et al. (2017) find larger groups than ours facing poaching from players outside the group, whom the group cannot communicate with, still have difficulties handling the poaching. These results argue in favor of the second explanation that the major problem in dividing groups is that each new group will no longer contain all the relevant fishers. We also need to replicate our experimental procedure with more than 2 divided TURFs. The harms of illegal fishing are well known, but issues of scale also extend beyond the lab; including in Chilean TURFs (Aburto et al., 2014). While further research can replicate our experiment in the field, Chávez et al. (2018) found both Chilean fishers in the field and university students behave comparably, suggesting our results also apply in the field. Therefore, we need empirical studies on inter-TURF dynamics to confirm our findings.
TURFs are a popular solution to crises in the fishing industry, but it is necessary to show the cure is not worse than the disease. Our results show instituting Territorial Use Rights for Fisheries programs can have significant adverse outcomes, and policy-makers must consider inter-TURF dynamics when designing programs.
Acknowledgements
We thank T. Guilfoos, T. Sproul, L. Rentschler, and two reviewers for helpful comments on the paper. We also thank C. Viteri, M. Servatka, D. Skarbek, A. Abatayo, and J. Lynham for helpful discussion about the work. The authors acknowledge support by the Center for Growth and Opportunity at Utah State University, the Charles Koch Foundation, the Hayek Fund for Scholars of the Institute for Humane Studies, and Conservation International.
Conflict of Interest
The authors declare no conflict of interest. The sponsors had no role in the design of the study; in the collection, analyses, or interpretation of data; in the writing of the manuscript, and in the decision to publish the results.
Author Contributions
All authors contributed to the data analysis and the writing of the manuscript. C.B. designed the experiment.
References
Abatayo, A.L., Lynham, J., 2016. Endogenous vs. exogenous regulations in the commons. Journal of Environmental Economics and Management 76, 51–66. https://doi.org/10.1016/j.jeem.2015.11.006.
Aburto, J., Gallardo, G., Stotz, W., Cerda, C., Mondaca-Schachermayer, C., Vera, K., 2013. Territorial user rights for artisanal fisheries in Chile—Intended and unintended outcomes. Ocean & Coastal Management 71, 284–295. https://doi.org/10.1016/j.ocecoaman.2012.09.015.
Aburto, J., Stotz, W., 2013. Learning about TURFs and natural variability: Failure of surf clam management in Chile. Ocean & Coastal Management 71, 88–98. https://doi.org/10.1016/j.oce-coaman.2012.10.013.
Aburto, J., Stotz, W., Cundill, G., 2014. Social-Ecological Collapse: TURF Governance in the Context of Highly Variable Resources in Chile. Ecology and Society 19. https://doi.org/10.5751/ES-06145-190102.
Afflerbach, J.C., Lester, S.E., Dougherty, D.T., Poon, S.E., 2014. A global survey of “TURF-reserves”, Territorial Use Rights for Fisheries coupled with marine reserves. Global Ecology and Conservation 2, 97–106. https://doi.org/10.1016/j.gecco.2014.08.001.
Agnew, D.J., Pearce, J., Pramod, G., Peatman, T., Watson, R., Beddington, J.R., Pitcher, T.J., 2009. Estimating the Worldwide Extent of Illegal Fishing. PLoS One 4. https://doi.org/10.1371/journal.pone.0004570.
Agrawal, A., Goyal, S., 2001. Group Size and Collective Action: Third-party Monitoring in Common-pool Resources. Comparative Political Studies 34, 63–93. https://doi.org/10.1177/0010414001034001003
Akerlof, G.A., Kranton, R.E., 2011. Identity Economics: How Our Identities Shape Our Work, Wages, and Well-Being. Princeton University Press.
Arroyo-Mina, J.S., Guerrero, D., 2018. Schumpeterian Behavior in a CPR Game: Experimental Evidence from Colombian Fisheries Under TURF’s Management. Mediterranean Journal of Social Sciences 9, 109–119. https://doi.org/10.2478/mjss-2018-0120.
Banks, J., Olson, M., Porter, D., Rassenti, S., Smith, V., 2003. Theory, experiment and the federal communications commission spectrum auctions. Journal of Economic Behavior & Organization 51, 303–350. https://doi.org/10.1016/S0167-2681(02)00149-X.
Bramoullé, Y., Kranton, R., 2015. Games Played on Networks.
Bramoullé, Y., Kranton, R., D’Amours, M., 2014. Strategic Interaction and Networks. American Economic Review 104, 898–930. https://doi.org/10.1257/aer.104.3.898.
Brown, D.N., Pomeroy, R.S., 1999. Co-management of Caribbean Community (CARICOM) fisheries. Marine Policy 23, 549–570. https://doi.org/10.1016/S0308-597X(98)00040-2.
Cardenas, J.-C., 2000. How Do Groups Solve Local Commons Dilemmas? Lessons from Experimental Economics in the Field. Environment, Development and Sustainability 2, 305–322. https://doi.org/10.1023/A:1011422313042.
Chávez, C.A., Murphy, J.J., Stranlund, J.K., 2018. Managing and defending the commons: Experimental evidence from TURFs in Chile. Journal of Environmental Economics and Management 91, 229– 246. https://doi.org/10.1016/j.jeem.2018.07.004.
Chen, Y., Li, S.X., 2009. Group Identity and Social Preferences. American Economic Review 99, 431–457. https://doi.org/10.1257/aer.99.1.431.
Christy, F.T., 1982. Territorial Use Rights in Marine Fisheries: Definitions and Conditions. Food & Agriculture Org.
Chuenpagdee, R., Jentoft, S., 2007. Step zero for fisheries co-management: What precedes implementation. Marine Policy 31, 657–668. https://doi.org/10.1016/j.marpol.2007.03.013.
Clark, C.W., 1973. Profit Maximization and the Extinction of Animal Species. Journal of Political Economy 81, 950–961. https://doi.org/10.1086/260090.
Cunningham, E., 2013. Catch Shares in Action: Mexican Baja California FEDECOOP Benthic Species Territorial Use Rights for Fishing System. Environmental Defense Fund. http://fisherysolutionscen-ter.edf.org/sites/catchshares.edf.org/files/Mexican_FEDECOOP_TURFs.pdf.
Dal Bó, P., Foster, A., Putterman, L., 2010. Institutions and Behavior: Experimental Evidence on the Effects of Democracy. American Economic Review 100, 2205–2229. https://doi.org/10.1257/aer.100.5.2205.
Davis, K., Kragt, M., Gelcich, S., Schilizzi, S., Pannell, D., 2015. Accounting for enforcement costs in the spatial allocation of marine zones. Conservation Biology 29, 226–237. https://doi.org/10.1111/cobi.12358.
Davis, K.J., Kragt, M.E., Gelcich, S., Burton, M., Schilizzi, S., Pannell, D.J., 2015. What prevents fishers from enforcing their user rights?Davis, K.J., Kragt, M.E., Gelcich, S., Burton, M., Schilizzi, S., and Pannell, D.J., 2015. “What Prevents Fishers from Enforcing Their User Rights?” Working Paper 204430. University of Western Australia, School of Agricultural and Resource Economics. https://econpapers.repec.org/paper/agsuwauwp/204430.htm.
De Geest, L.R., Stranlund, J.K., Spraggon, J.M., 2017. Deterring poaching of a common pool resource. Journal of Economic Behavior & Organization 141, 254–276. https://doi.org/10.1016/j.jebo.2017.06.006.
Defeo, O., Castilla, J.C., 2005. More than One Bag for the World Fishery Crisis and Keys for Co-management Successes in Selected Artisanal Latin American Shellfisheries. Rev Fish Biol Fisheries 15, 265–283. https://doi.org/10.1007/s11160-005-4865-0.
del Pilar Moreno-Sánchez, R., Maldonado, J.H., 2010. Evaluating the role of co-management in improving governance of marine protected areas: An experimental approach in the Colombian Caribbean. Ecological Economics 69, 2557–2567. https://doi.org/10.1016/j.ecolecon.2010.07.032.
Delgado, C.L., Nikolas, W., W, R., Mark, Siet, M., Mahfuzuddin, A., 2003. Outlook for Fish to 2020: Meeting Global Demand. Intl Food Policy Res Inst.
Diehl, M., 1990. The Minimal Group Paradigm: Theoretical Explanations and Empirical Findings. European Review of Social Psychology 1, 263–292. https://doi.org/10.1080/14792779108401864.
Epstein, G., Andrews, E., Armitage, D., Foley, P., Pittman, J., Brushett, R., 2018. Human dimensions of ecosystem-based management: Lessons in managing trade-offs from the Northern Shrimp Fishery in Northern Peninsula, Newfoundland. Marine Policy 97, 10–17. https://doi.org/10.1016/j.mar-pol.2018.08.018.
Estrin, S., 2010. Self-Management: Economic Theory and Yugoslav Practice. Cambridge University Press.
Falk, A., Heckman, J.J., 2009. Lab Experiments Are a Major Source of Knowledge in the Social Sciences. Science 326, 535–538. https://doi.org/10.1126/science.1168244.
Fernández, G.G., Stotz, W., Aburto, J., Mondaca, C., Vera, K., 2011. Emerging commons within artisanal fisheries. The Chilean territorial use rights in fisheries (TURFs) within a broader coastal landscape. International Journal of the Commons 5, 459–484. https://doi.org/10.18352/ijc.281.
Fischbacher, U., 2007. z-Tree: Zurich toolbox for ready-made economic experiments. Experimental Economics 10, 171–178. https://doi.org/10.1007/s10683-006-9159-4.
Gallier, C., Langbein, J., Vance, C., 2016. That’s My TURF: An Experimental Analysis of Territorial Use Rights for Fisheries in Indonesia (SSRN Scholarly Paper No. ID 2798616). Social Science Research Network, Rochester, NY.
Gerrodette, T., Dayton, P.K., Macinko, S., Fogarty, M.J., 2002. Precautionary Management of Marine Fisheries: Moving Beyond Burden of Proof [WWW Document]. URL http://www.ingentaconnect.com/content/umrsmas/bullmar/2002/00000070/00000002/art00018 (accessed 2.21.19).
González, J., Stotz, W., Garrido, J., M. (Lobo) Orensanz, J., Parma, A., Tapia, C., Zuleta, A., 2006. The Chilean TURF system: how is it performing in the case of the loco fishery? Bulletin of Marine Science 78, 499–527.
Hargreaves Heap, S.P., Zizzo, D.J., 2009. The Value of Groups. American Economic Review 99, 295–323. https://doi.org/10.1257/aer.99.1.295.
Hayo, B., Vollan, B., 2012. Group interaction, heterogeneity, rules, and co-operative behaviour: Evidence from a common-pool resource experiment in South Africa and Namibia. Journal of Economic Behavior & Organization 81, 9–28. https://doi.org/10.1016/j.jebo.2011.09.002.
Ishikida, T., Ledyard, J., Porter, D., 1998. Implementation of a Combinatorial Market. The Experiments Behind the Automated-Environmental Credit Exchange (ACE) 30.
Janssen, M.A., Bousquet, F., Cardenas, J.-C., Castillo, D., Worrapimphong, K., 2013. Breaking the elected rules in a field experiment on forestry resources. Ecological Economics 90, 132–139. https://doi.org/10.1016/j.ecolecon.2013.03.012.
Janssen, M.A., Ostrom, E., 2008. TURFS in the lab: Institutional Innovation in Real-Time Dynamic Spatial Commons. Rationality and Society 20, 371–397. https://doi.org/10.1177/1043463108096786.
King, D.M., Porter, R.D., Price, E.W., 2009. Reassessing the Value of U.S. Coast Guard At-Sea Fishery Enforcement. Ocean Development & International Law 40, 350–372. https://doi.org/10.1080/00908320903285414.
Kranton, R., Pease, M., Sanders, S., Huettel, S., 2018. Groupy and Not Groupy Behavior: Deconstructing Bias in Social Preferences
Kuperan, K., Sutinen, J.G., 1998. Blue Water Crime: Deterrence, Legitimacy, and Compliance in Fisheries. Law & Society Review 32, 309–338. https://doi.org/10.2307/827765.
Macinko, S., Raymond, L., 2001. Fish on the range: the perils of crossing conceptual boundaries in natural resource policy. Marine Policy 25, 123–131. https://doi.org/10.1016/S0308-597X(01)00002-1.
Macpherson, C.B., 1978. Property, Mainstream and Critical Positions. University of Toronto Press.
Mathiesen, Á., 2012. The State of World Fisheries and Aquaculture-2012, 2012th ed, The State of World Fisheries and Aquaculture. Food and Agriculture Organization of the United Nations, Rome, Italy.
McCay, B.J., 2017. Territorial use rights in fisheries of the northern Pacific coast of Mexico [WWW Document]. https://doi.org/info:doi/10.5343/bms.2015.1091.
Miller, R.J., 2008. A sea urchin dive fishery managed by exclusive fishing areas, in: Townsend, R.E., Shotton, R., Uchida, H. (Eds.), Case Studies in Fisheries Self-Governance, FAO Fisheries Technical Paper. Food & Agriculture Org., Rome, Italy, p. 77.
Ness, I., Azzellini, D., 2011. Ours to Master and to Own: Workers’ Control from the Commune to the Present. Haymarket Books.
Orensanz, J., Parma, A., 2010. Successful Experiment? Samudra 55, 42–46.
Panayotou, T., 1984. Territorial use rights in fisheries (No. 289), Fisheries and Reports. FAO.
Poon, S., Bonzon, K., 2013. Catch Share Design Manual Volume 3: Territorial Use Rights for Fishing.
San Martín, G., Parma, A., Orensanz, J.M.L., 2010. The Chilean experience with territorial use rights in fisheries, in: Grafton, R.Q., Hilborn, R., Squires, D., Tait, M., Williams, M. (Eds.), Handbook of Marine Fisheries Conservation and Management, Oxford University Press, pp. 324.
Santis, O., Chávez, C., 2015. Quota compliance in TURFs: An experimental analysis on complementarities of formal and informal enforcement with changes in abundance. Ecological Economics 120, 440–450. https://doi.org/10.1016/j.ecolecon.2015.11.017.
Schmitt, P.M., 2004. On Perceptions of Fairness: The Role of Valuations, Outside Options, and Information in Ultimatum Bargaining Games. Experimental Economics 7, 49–73. https://doi.org/10.1023/A:1026210021955.
Schnier, K.E., 2009. Spatial externalities and the common-pool resource mechanism. Journal of Economic Behavior & Organization 70, 402–415. https://doi.org/10.1016/j.jebo.2009.02.004.
Scott, A., 1955. The Fishery: The Objectives of Sole Ownership. Journal of Political Economy 63, 116– 124. https://doi.org/10.1086/257653.
Sustainable fisheries [WWW Document], 2013. Fishery Solutions Center. URL http://fisherysolution-scenter.edf.org/sustainable-fisheries (accessed 2.20.19).
Sutinen, J.G., Kuperan, K., 1999. A socio-economic theory of regulatory compliance. International Journal of Social Economics 26, 174–193.
Sutinen, J.G., Rieser, A., Gauvin, J.R., 1990. Measuring and explaining noncompliance in federally managed fisheries. Ocean Development & International Law 21, 335–372. https://doi.org/10.1080/00908329009545942.
Tajfel, H., Billig, M.G., Bundy, R.P., Flament, C., 1971. Social categorization and intergroup behaviour. European Journal of Social Psychology 1, 149–178. https://doi.org/10.1002/ejsp.2420010202.
Tajfel, H., Turner, J., 2001. An integrative theory of intergroup conflict, in: Hogg, M.A., Abrams, D. (Eds.), Intergroup Relations: Essential Readings, Key Readings in Social Psychology. Psychology Press, New York, NY, US, pp. 94–109.
Territorial Use Rights for Fishing (TURF) Programs [WWW Document], 2013. Fishery Solutions Center. URL http://fisherysolutionscenter.edf.org/catch-share-basics/turfs (accessed 2.20.19).
Uchida, H., Uchida, E., Lee, J.-S., Ryu, J.-G., Kim, D.-Y., 2010. Does Self Management in Fisheries Enhance Profitability? Examination of Korea’s Coastal Fisheries. Marine Resource Economics 25, 37–59. https://doi.org/10.5950/0738-1360-25.1.37.
Velez, M.A., Stranlund, J.K., Murphy, J.J., 2012. Preferences for government enforcement of a common pool harvest quota: Theory and experimental evidence from fishing communities in Colombia. Ecological Economics 77, 185–192. https://doi.org/10.1016/j.ecolecon.2012.02.030.
Villena, M., Chavez, C., 2005. On the Enforcement of Territorial Use Rights Regulations: A Game Theoretic Approach. Economia 6, 1–44.
Viteri, C., Chávez, C., 2007. Legitimacy, local participation, and compliance in the Galápagos Marine Reserve. Ocean & Coastal Management, The Galapagos Islands and the Archipelago of San Andres 50, 253–274. https://doi.org/10.1016/j.ocecoaman.2006.05.002.
Wakamatsu, M., Anderson, C.M., 2018. The Endogenous Evolution of Common Property Management Systems. Ecological Economics 154, 211–217. https://doi.org/10.1016/j.ecolecon.2018.08.007.
Wilen, J.E., Cancino, J., Uchida, H., 2012. The Economics of Territorial Use Rights Fisheries, or TURFs. Rev Environ Econ Policy 6, 237–257. https://doi.org/10.1093/reep/res012.
Young, O.R., 1979. Compliance & Public Authority; A Theory with International Applications. Johns Hopkins University Press, Baltimore.